
Market Forces 011
September 12, 2023
Market Commentary
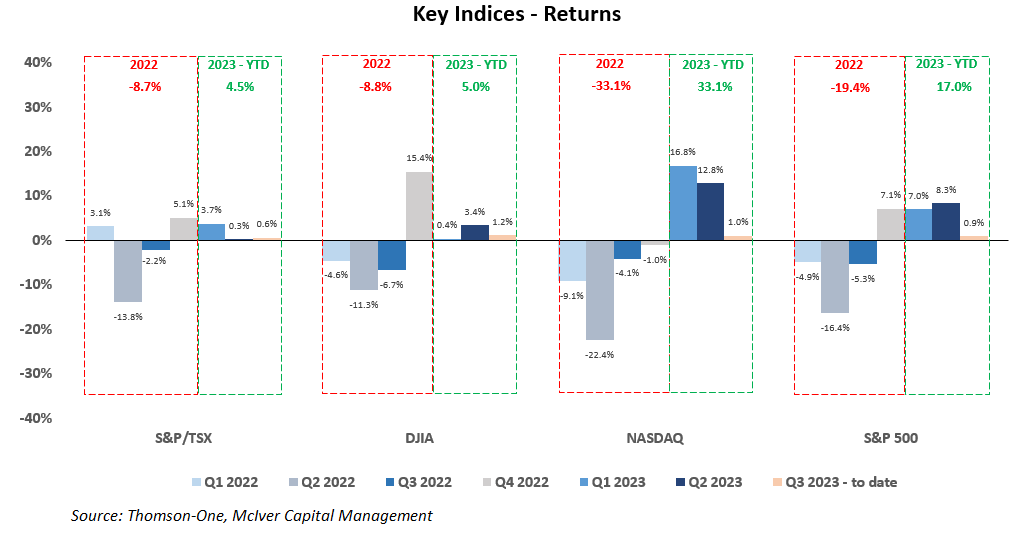
The strong performance from equity markets in the first quarter continued into the second, though we have seen some moderation in returns in the third quarter to date (key markets flat to marginally up). For 2023 so far, we have continued to see strong returns from the S&P 500 and NASDAQ (up ~17% and ~33% respectively), whilst the DJIA and TSX remained the exceptions, generating ~5% returns so far in 2023.
Whilst equities have been robust on aggregate, the performance of bonds has been far more variable.
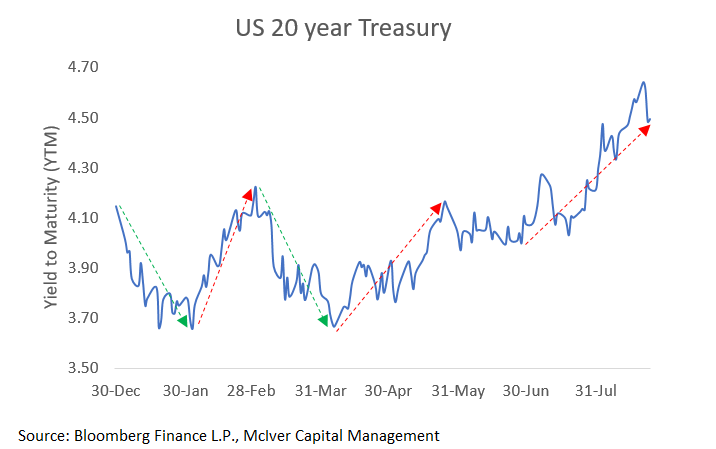
Unprecedented moves in the bond market
The key 20-year US treasury bond rallied in January (yields fell by ~50 basis points), then gave up much of those gains with a reversal in February (yields rose by 40-45 basis points), only to again reverse course, rallying in March (yields fell 35-40bp), only then to reverse once again with yields increasing by ~50bp from early April levels to those seen in late May. Volatility then stepped down in later May and June, only for bonds to then sell off again (with yields increasing again by another ~50bp), and breaching levels seen in October of 2022.
We continue to note that moves of the magnitude seen year to date are an infrequent and extreme occurrence.
On the economic front, the economy and labour market has shown remarkable resilience to date, and inflation continues to recede, though the consequence of this economic resilience appears to be market recognition that interest rates are likely to remain elevated for an extended period as evidence by the above-mentioned move in yields.
A quick look at current valuations… and valuation metrics
In the past, we have indicated that on aggregate we do not believe valuations are overly compelling and continue to highlight the economic risks (more on this later).
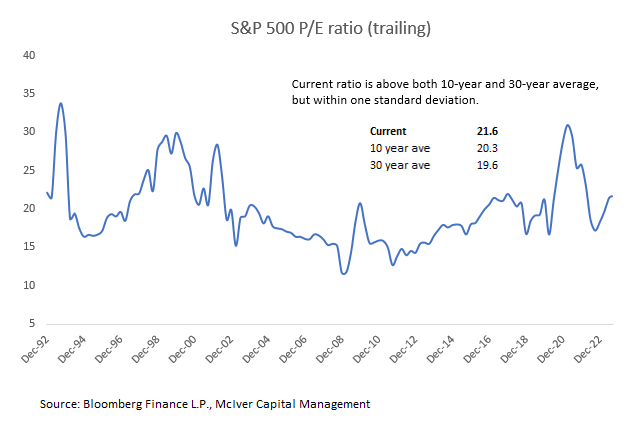
If we look at the P/E ratio (price to earnings, or more simply explained as how many years of current earnings are needed to recoup the purchase price) of the S&P 500 we note that current levels sit above long-term averages, but not dramatically so (as evidenced by being within one standard deviation of the average).
We will now take a deeper analytic dive into the historic data on the S&P 500 and its P/E ratio, but before we do so we need to acknowledge that the P/E is a highly simplistic metric, and its popularity likely arises more from its ease of use than its predictive power.
The term ‘predictive power’ may be unfamiliar to most, so lets explain this using a weather analogy. If we noticed that most of the time after seeing grey clouds in the sky, we tended to see rain, we would likely conclude that grey clouds have predictive power in terms of predicting, or forecasting, rain.
P/E = Current Price / Earnings*
* Earnings could be either on a retrospective (i.e. past twelve months of actual earnings) or prospective basis (i.e. expected earnings for the next twelve months)
Lower P/Es would generally be viewed as an indication that the asset is “cheap” and higher P/Es as an indication that the asset is “expensive”. Let us disavow these notions immediately.
Fundamentally, all assets are worth their future projected cash flows discounted by the appropriate rate reflecting the riskiness of those CFs. The growth rate of these cash flows (let’s substitute earnings as a proxy for now) is critical to valuation. As the P/E ratio is based on past earnings** it implicitly ignores the all-important factor that is growth.
** We have chosen to assess the P/E ratio based on a retrospective (i.e. past twelve months of actual earnings) basis as this removes the forecast risk that we would encounter if using the prospective basis (i.e. expected earnings for the next twelve months)
“Invert, always invert…” Charlie Munger
A better way of viewing the P/E ratio is by looking at it from the opposite angle; to view the ratio as a rough indication of the quantum of growth in earnings that the market is expecting from the stock.
The results of our analysis back this up, and indicate that whilst P/Es have some predictive power when it comes to earnings, i.e. the market seems to be fairly good at pricing future earnings evidenced by the data showing higher P/Es tend to be associated with higher levels of future earnings growth, the same cannot be said for the predictive power when it comes to future returns.
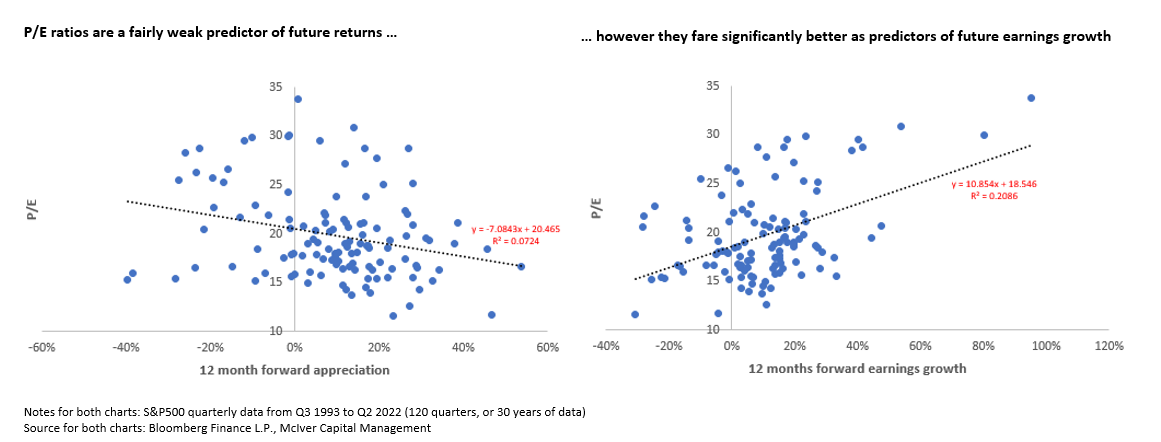
Generally, we would stop here at this stage of the analysis, but on visually assessing the above chart it seemed that somewhat different dynamics were at play at varying levels of the P/E ratio.
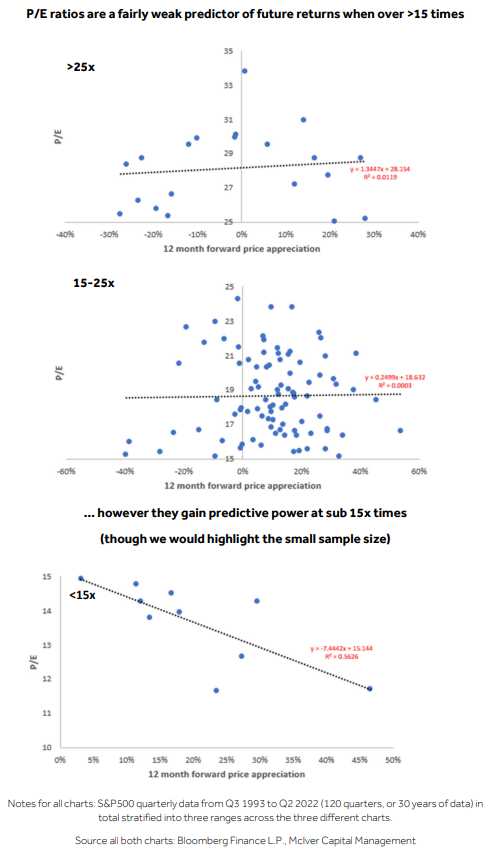
The charts below show the results of this stratification exercise where we divided the data into three separate PE bands namely, <15x, 15-25x, and >25x, and we would highlight the following:
- PE ratios are a generally poor predictor of future returns, though they appear to gain some predictive power at depressed P/E ratios (sub 15x), but we would caution that the sample size is fairly small (only 10 data points).
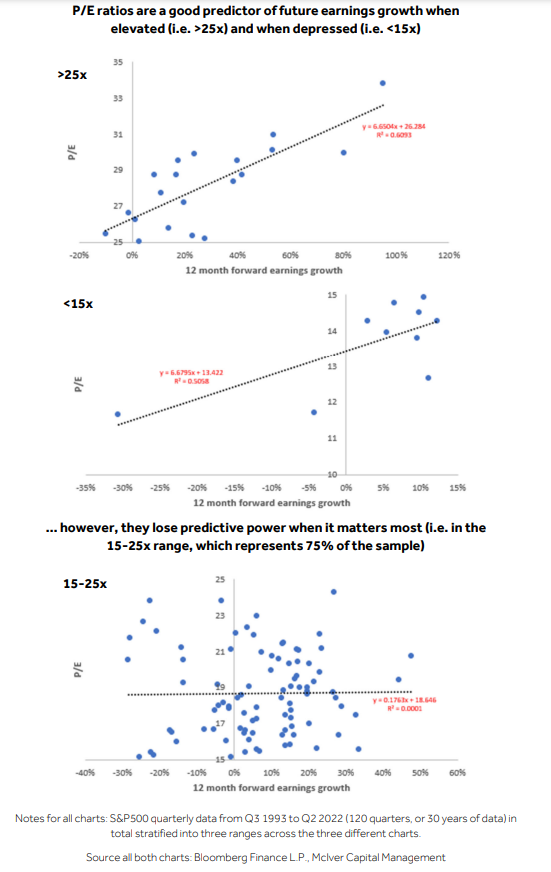
- PE ratios are a generally good predictor of future earnings growth, though only at the extremes (i.e. >25x and <15x), and appear to lose predictive power when it matters most, namely when the market is trading at 15-25x times, which represented 75% of the 30-year period being examined.
A final thought on P/Es
Hopefully, the above analysis has highlighted some of the weaknesses in overly relying on any one metric. Investing is about deep fundamental research rooted in absolute valuation (i.e. a DCF, or discounted cash flow methodology) taking cognizance of a number of relative metrics as well (including, but not limited to the P/E ratio) to add some context.
Suffice it to say that anyone advocating for the purchase of a security using this metric as the sole investment basis only highlights the degree to which they lack the inherent understanding of the metric itself.
Remember this the next time a random stranger offers up a stock tip on this basis. If that random stranger happens to be neither random, nor a stranger and is managing your assets, it may be worthwhile to go elsewhere… you know where to reach us 😊
We continue to advocate for a defensive positioning
A frequent reader would assess, correctly, that the strength of the market, and probably more so the sectors from which that strength has emanated has gone against our view of retaining a relatively more defensive positioning.
On a relative basis, this positioning benefitted the portfolio significantly in 2022, but there is no sugarcoating that it has hurt so far in 2023 (it is worth noting that despite this, performance for the calendar year to date remains solid all considering).
The one question I find instructive in money management that helps to avoid or mitigate the behavioral biases we are all subject to is simply this:
As it stands now, do we believe the portfolio is best positioned going forward from a risk/return basis?
Investing is a process. Every day we assess assets held and evaluate new potential portfolio additions. If we take any action, our bottom-line decision criteria is, that we should only execute on actions that we believe improve the positioning of client portfolios.
All said, we continue to advocate for a relatively defensive positioning, and would highlight the following:
Aggregate valuations are not compelling…
The P/E (price to earnings), P/B (price to book value), P/S (price to sales), and P:CF (price to cash flow) for the S&P 500 on a trailing twelve-month basis are all above the 10-year average, though they all remain within one standard deviation (with the exception of the P/B ratio which is in excess of one standard deviation of the 10-year average).
…especially in light of the economic challenges
The scale of monetary tightening, both in terms of the degree to which, and the speed at which, central banks have increased rates is unprecedented.
Graph comparing this interest rate cycles to others (Source: Visual Capitalist)
The impact of rates is still being, and will continue to be, felt for some time. Predicting the economy is not an easy task, so it’s probably worthwhile to re-iterate the caveat from a prior commentary.
“Forecasting is a generally humbling experience, but financial markets look forward, and we need to do the same. Ironically, forecasting from an individual security investment perspective largely isn’t the most productive use of time. Effort is better spent finding an investment opportunity that has highly favourable risk-reward (i.e. a favourable outcome if one is correct, and a still favourable, though less so, outcome if one is incorrect, i.e. a win-win), vs. getting an estimate on some macroeconomic figure accurate to the 1/10th of a percent.” Source: Market Forces 007
There have been a lot of recent increases in discussion on whether the long-anticipated recession will eventually arrive, or if the central bankers will be able to pull off a “soft-landing”.
From an equity market perspective, whilst a recession would be negative for equities (considering market expectation for an earnings recovery), I am not altogether convinced that a soft-landing (i.e. a period of lackluster economic growth, but not meeting the technical definition of a recession) is positive for equities, especially considering the relationship between demand and inflation.
We will expand upon this view in greater depth in the next commentary, as well as explore the impact across additional asset classes.
Positioning is key
Currently, tactical cash holdings within client portfolios sits at the highest relative levels ever.
This gives us the additional flexibility to allocate to opportunities that we believe will arise over the course of the next 6-12 months. Additionally, with elevated interest yields (money market rates are near 5%, a far cry from the near zero over 18 months ago), the “drag” from holding cash in the short term, is less pronounced than previously.
Process is always foundational, and we believe security selection will continue to play an outsized role
We continue to highlight the foundational importance of disciplined asset allocation within an investment process, complement by rigorous stock selection. In the current market environment, we believe stock-picking capability will prove increasingly important.
Investors should have a candid look at their money managers and assess their capabilities in this respect. It is for this exact reason, that top-tier firms (CG included) typically support employees, financially and otherwise in the pursuit and maintenance of designations of this sort.
Not to toot our own horn, but, as currently constituted, the McIver Capital Management Investment Committee collectively holds the following designations, postgraduate degrees, and importantly market experience.
- Professional designations/certifications:
Chartered Financial Analyst (CFA), Financial Risk Manager (FRM), Chartered Alternative Investment Analyst (CAIA), Chartered Investment Manager (CIM) x 2 - Postgraduate degrees:
Master’s in Business Administration (MBA) - Decades of cumulative financial markets experience, including:
Wealth Management experience
Buy-side experience
Sell-side experience (as a highly rated sell-side analyst)
We would expect to be adding, organically, a Certified Financial Planner (CFP) to this list over the next 6 months (good luck for your exams, Matt).
As always, we remain focused on the stewardship of client assets entrusted to us.
Happy rest of summer.
Sincerely,
Warren Goldblum
wgoldblum@cgf.com
On behalf of McIver Capital Management
MCIVER CAPITAL MANAGEMENT MODEL PERFORMANCE (click here)
At July 31, 2023
(Net-to-client, third-party audited)
| 10 Year Annualized |
5 Year Annualized |
1 Year Annualized |
Year-to-date | Since Inception |
Annualized Std Deviation* |
|
| P1 – Very Conservative | 5.23% | 4.80% | 3.09% | 3.78% | 4.81% | 6.52% |
| P2 – Conservative | 6.37% | 5.10% | 3.90% | 4.96% | 6.33% | 7.59% |
| P3 – Conservative Value | 7.66% | 6.19% | 6.11% | 6.72% | 7.46% | 8.98% |
| P4 – Conservative Growth | 7.95% | 6.34% | 6.80% | 7.49% | 8.39% | 9.43% |
| P5 – Growth | 8.96% | 7.01% | 8.41% | 8.24% | 8.79% | 10.01% |
Performance returns are as of July 31st, 2023 and are based on composites of actual accounts. The indicated rates of return are net of fees. Please note that past performance is not necessarily an indicator of future performance. Individual results of clients’ portfolios may differ from that of the composite portfolio returns as fees may differ, and performance of specific accounts is based on specific account investiture. The noted model portfolios may not be appropriate for all investors. Inception to August 31, 2018 are representative net, model account returns in C$ provided by the portfolio manager. All model portfolios have an inception date of January 1, 2010 except for P4 (incepted June 30, 2010), P7 (incepted April 30, 2010), and P10 (incepted March 31, 2015). * Annualized Standard Deviation is calculated using monthly returns for the longest return period reported in the corresponding row. It is a measure of historical volatility where a lower figure represents less volatility.
Do You Want To Know More?
Give us a call, let's have a chat.
Ask all your questions, get all the answers and hear about all the benefits. Don’t worry, we are sure we can find a custom solution for your specific case.
Call us at +1 (604) 643-7337
Email us at nmciver@cgf.com